
While calculating expected ROI for CRM implementations is best handled with spreadsheets, mind maps are a handy way to chart the value chains that will feed the spreadsheet calculations.
On a single page, we can trace exactly how we expect ROI to be delivered, and create cause-effect chains that communicate and help validate our logic.
The example below forecasts that sales performance improvements are expected to yield $1.5 million in annual return. But how exactly will this improvement be realized?
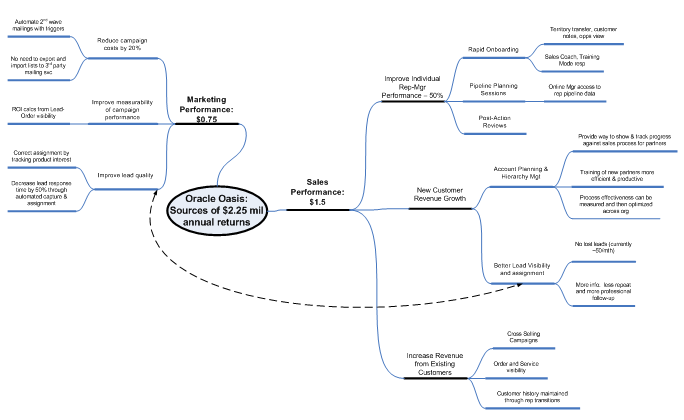
Follow the branches into deeper and more concrete details, and you easily see the specific functions and improvements that contribute to the particular ROI metric.
By mapping out this process, it becomes clear what specific functions are most critical to the project and thus deserve extra attention from the project team to ensure they are implemented effectively.